Single-cell Reference Guided Gene Expression Embedding#
A single-cell reference provides complementary molecular context beyond histology and can improve prediction. Below, we describe how we construct the gene expression embedding from the single-cell reference.
Cell-type deconvolution using RCTD#
First, you need to build a single-cell reference (paired with ST data or from similar tissues) with cell type labels saved as celltype in metadata.
Save the reference as sc_reference.RDS. This step is not included in spEnhance workflow.
Next, we computed the cell type-by-gene reference matrix \(\mathbf{R} \in\mathbb{R}^{C\times G}\), where each entry \(R_{c,g}\) is the mean expression of gene \(g\) across all cells of type \(c\).
Then we apply RCTD to deconvolve each spot, yielding \(\mathbf{\Pi}=[\pi_{s,c}]\in[0,1]^{S\times C}\),
which estimates the fraction of each cell type present in spot \(s = 1, \dots, S\) (rows summing to one).
Rscript run_rctd.R ${prefix}sc_reference.RDS ${prefix}cnts_train_seed_1.csv ${prefix}locs.csv ${prefix} 4
- Input:
${prefix}sc_reference.RDS: paired single cell reference. You can replace it with file name of your own. Cell type labels shoule be saved ascelltypeinmetadata${prefix}cnts_train_seed_1.csv: count matrix for deconvolution. Do not use the unsplit data.${prefix}locs.csv: spot location matrix paired with the previous count matrix.
- Parameters:
${prefix}: directory to the folder containing the files, i.e.data/.
- Output:
proportion_celltype.csv: spot deconvolution results, with each row representing a spot and each column representing a cell type (row summing to one).locs_celltype.csv: spot location matrix paired withproportion_celltype.csv.reference.csv: cell type-by-gene reference matrix calculated using single-cell reference.
Additionally, obtain cell type names by running:
python select_genes.py --n-top=600 ${prefix}"proportion_celltype.csv" ${prefix}"cell-type-names.txt"
Cell type names will be saved into cell-type-names.txt.
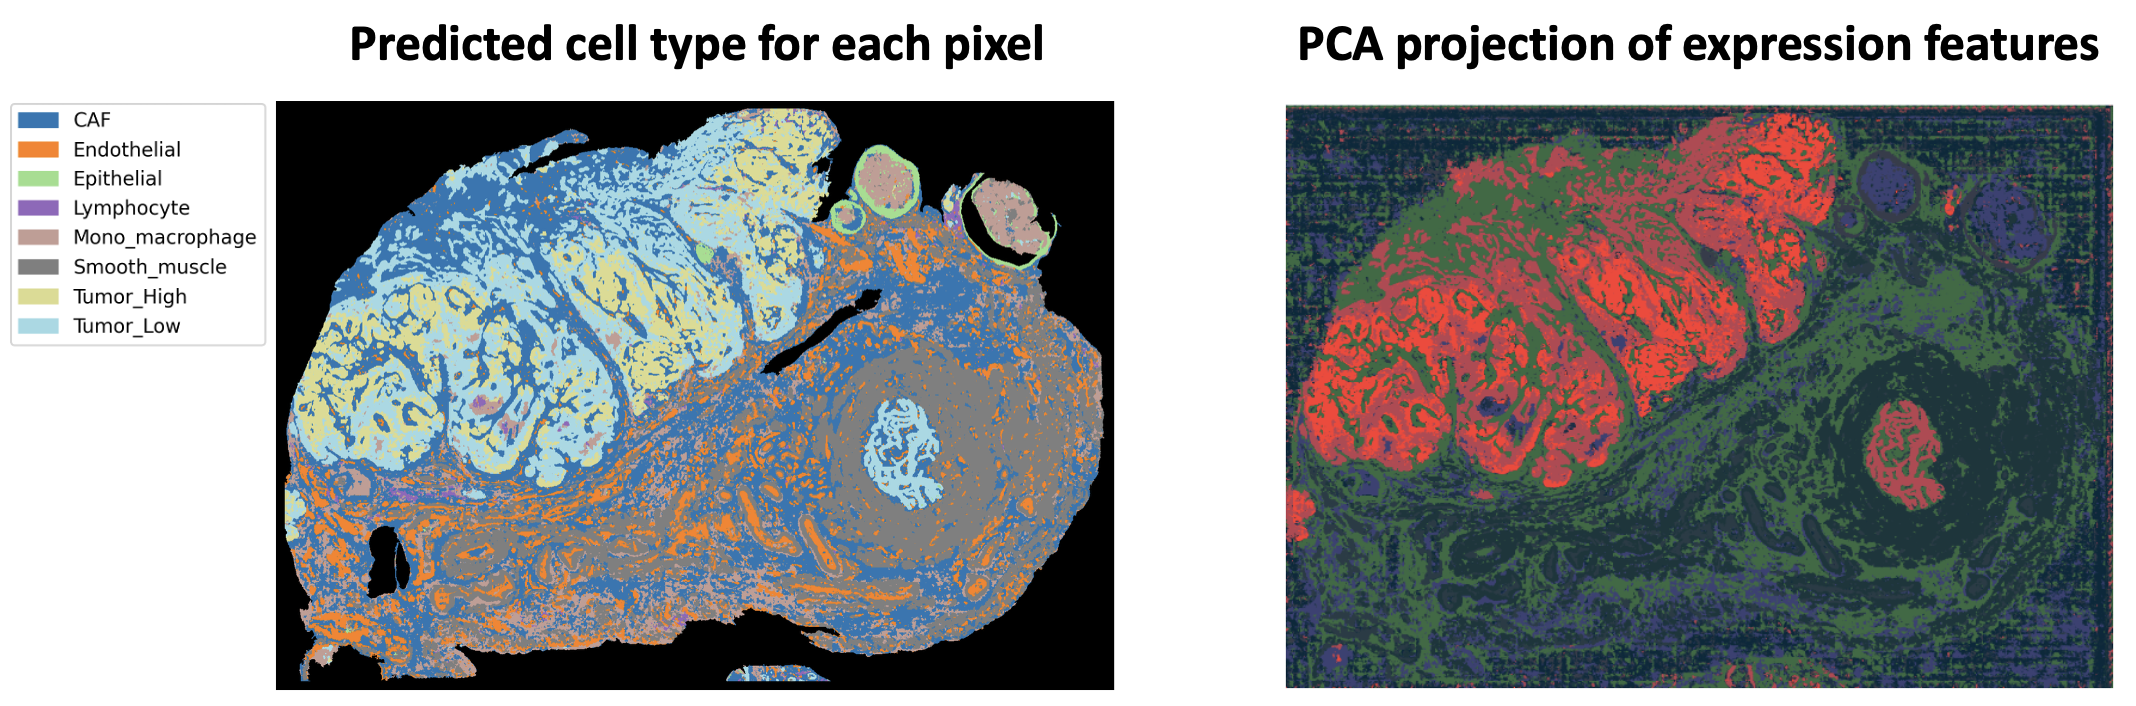
Pixel-level cell type prediction#
To predict pixel-level cell types, we train a graph convolutional network (GCN) that maps the histology embedding \(\mathbf{U}\) to pixel-wise probabilities \(\mathbf{P} \in[0,1]^{H_1\times W_1\times C}\), using the spot-level deconvolution \(\mathbf\Pi\) for weak supervision.
python impute_slide_celltype.py ${prefix} --epochs=100 --device='cuda' --n_states=5
- Input:
embeddings-hist-merged.pickle: merged histology features.proportion_celltype.csv: spot deconvolution results, containing estimated proportion of each cell type in each spot.locs_celltype.csv: spot location matrix paired withproportion_celltype.csv.cell-type-names.txt: file containing cell type names.
- Parameters:
${prefix}: directory to the folder containing the files, i.e.data/.--device: choosing which device to use, eithercudaorcpu.--n_states: number of states (number of independent models trained, validated and used for prediction)
- Output:
Cell_proportion/: predicted cell type proportion for each pixel, with each cell type saved in aCELL-TYPE.picklefile.
The use of GPU is highly recommended.
Gene expression feature assignment#
Given the cell type-by gene reference matrix \(\mathbf{R}\) and the pixel-level cell-type probabilities \(\mathbf{P}\), we assign a gene-expression value at pixel \((h,w)\) via \(V_{h,w,g}^{(0)} \;=\; \sum_{c=1}^C P_{h,w,c}\, R_{c,g}\). Collecting all genes and pixels forms the tensor \(\mathbf{V}^{(0)} \in \mathbb{R}^{H_1 \times W_1 \times G}\).
To extract compact representations, we reduce the gene dimension using truncated SVD to obtain the gene feature embedding \(\mathbf{V} \in \mathbb{R}^{H_1 \times W_1 \times G_1}\).
python assign_reference.py ${prefix} --mode='combined' --normalize='gene-zscore' --dim=256
- Input:
Cell_proportion/: predicted cell type proportion for each pixel.reference.csv: cell type-by-gene reference matrix calculated using single-cell reference.
- Parameters:
${prefix}: directory to the folder containing the files, i.e.data/.--mode: two modes of assigning reference gene expression for each cell type are provided.combined: each pixel’s gene expression was estimated by linearly combining cell-type reference profiles using the pixel’s predicted cell-type proportions as weights.uncombined: each pixel’s gene expression was estimated as the cell-type reference profiles of the most probable cell type.
--normalize: two modes of normalization offered.gene-zscore: z-score normalization for each gene across all pixels.celltype: z-score normalization for all genes in the same cell type.
--dim: number of reduced dimensions of gene expression features.
- Output:
embeddings-gene.pickle: gene expression embedding.embeddings-combined.pickle: combined embeddings of both gene expression and histological features.